Graphing barometer - storm Doris
Posted: Sat Feb 25, 2017 12:11 pm
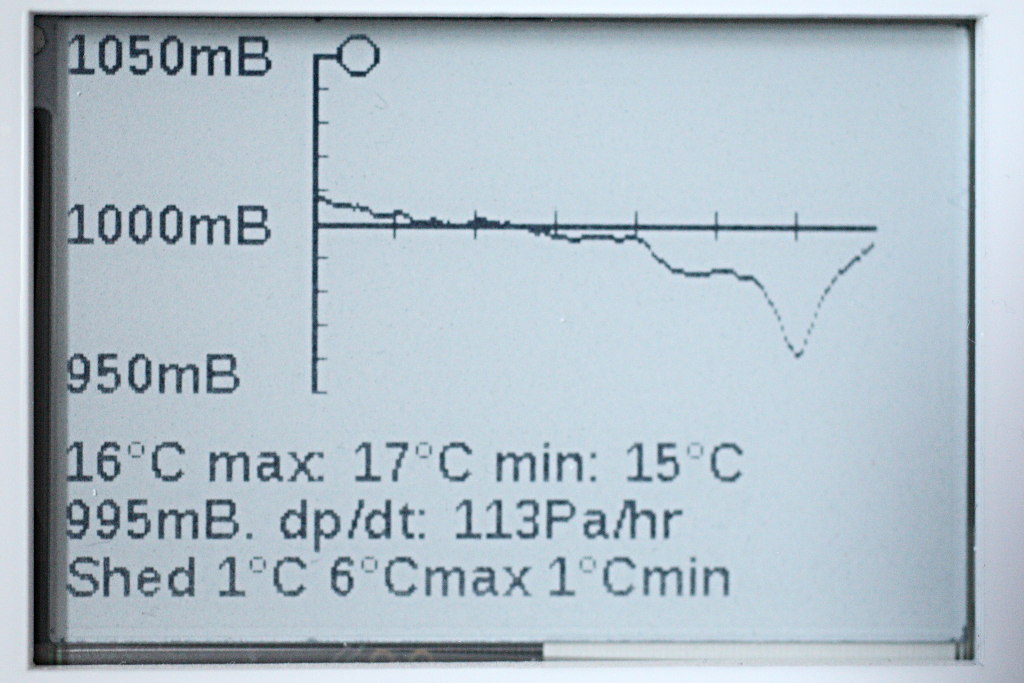
I built this about a year ago. Note the display showing Storm Doris passing over. Horizontal scale one week, divisions each day. The circle adjacent to the Y axis shows rate of change of pressure, a forward indicator of weather.
I've not posted an image of the slaves as they are featureless white boxes
It gathers data from three remote locations using NRF24L01+ radios, logging it to an SD card. The remote units (with one exception) have run continuously on three AA cells. All four units wake up hourly from deep sleep. The master has a calibrated RTC and each slave updates their RTC from the master every hour, so that precise synchronisation is maintained. Each slave has a one minute time slot in which to communicate with the master. Typically each slave wakes for a very few seconds only - the one which has needed new batteries has tended to have communication problems owing to having a chip antenna rather than a duck.
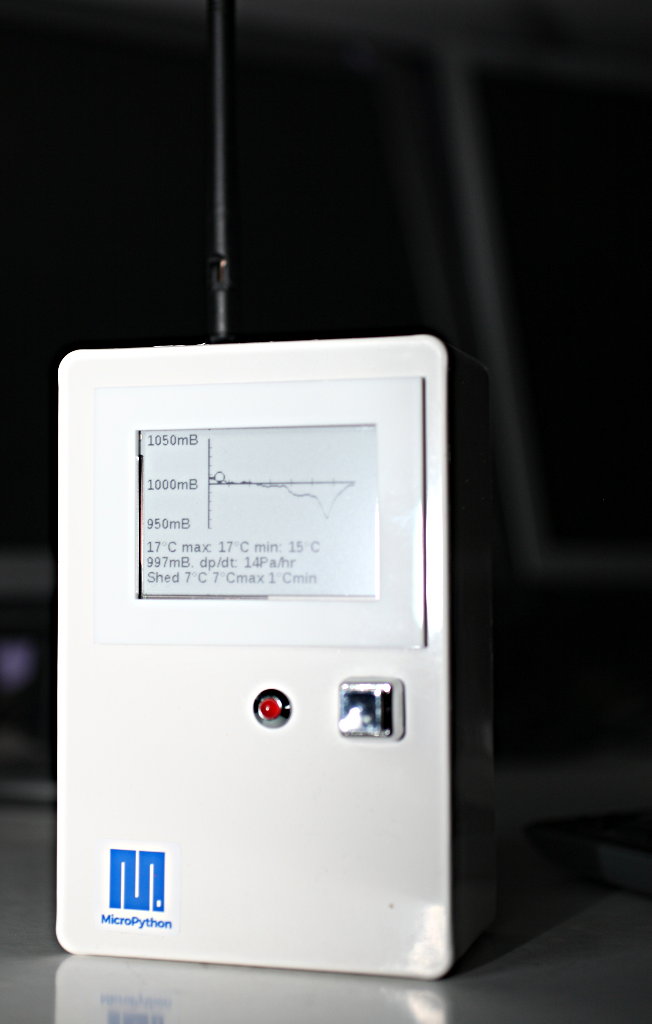
The pushbutton wakes the Pyboard and displays an alternate screen which tabulates data from the remotes. Data returned includes the battery voltage which is displayed if below threshold so dying cells can be replaced.
The master uses a rechargeable LiPoly cell as it wakes for four minutes in every hour and has to refresh the ePpaper display. Originally it too was powered from AA cells but I was having to change them every three months. It's demonstrated the ability of Pyboards to run with very low power consumption, and to survive under conditions of changing temperature and humidity.
[EDIT]Code references for subsystems:
ePaper display driver https://github.com/peterhinch/micropython-epaper.git
NRF24L01+ radio protocols https://github.com/peterhinch/micropython-radio
RTC calibration https://github.com/peterhinch/micropython-samples.git see DS3231.
Micropower operation of Pyboards https://github.com/peterhinch/micropyth ... opower.git
I've not posted an image of the slaves as they are featureless white boxes
It gathers data from three remote locations using NRF24L01+ radios, logging it to an SD card. The remote units (with one exception) have run continuously on three AA cells. All four units wake up hourly from deep sleep. The master has a calibrated RTC and each slave updates their RTC from the master every hour, so that precise synchronisation is maintained. Each slave has a one minute time slot in which to communicate with the master. Typically each slave wakes for a very few seconds only - the one which has needed new batteries has tended to have communication problems owing to having a chip antenna rather than a duck.
The pushbutton wakes the Pyboard and displays an alternate screen which tabulates data from the remotes. Data returned includes the battery voltage which is displayed if below threshold so dying cells can be replaced.
The master uses a rechargeable LiPoly cell as it wakes for four minutes in every hour and has to refresh the ePpaper display. Originally it too was powered from AA cells but I was having to change them every three months. It's demonstrated the ability of Pyboards to run with very low power consumption, and to survive under conditions of changing temperature and humidity.
[EDIT]Code references for subsystems:
ePaper display driver https://github.com/peterhinch/micropython-epaper.git
NRF24L01+ radio protocols https://github.com/peterhinch/micropython-radio
RTC calibration https://github.com/peterhinch/micropython-samples.git see DS3231.
Micropower operation of Pyboards https://github.com/peterhinch/micropyth ... opower.git