A power meter - using the Pyboard as a measuring instrument
Posted: Mon Oct 30, 2017 10:05 am
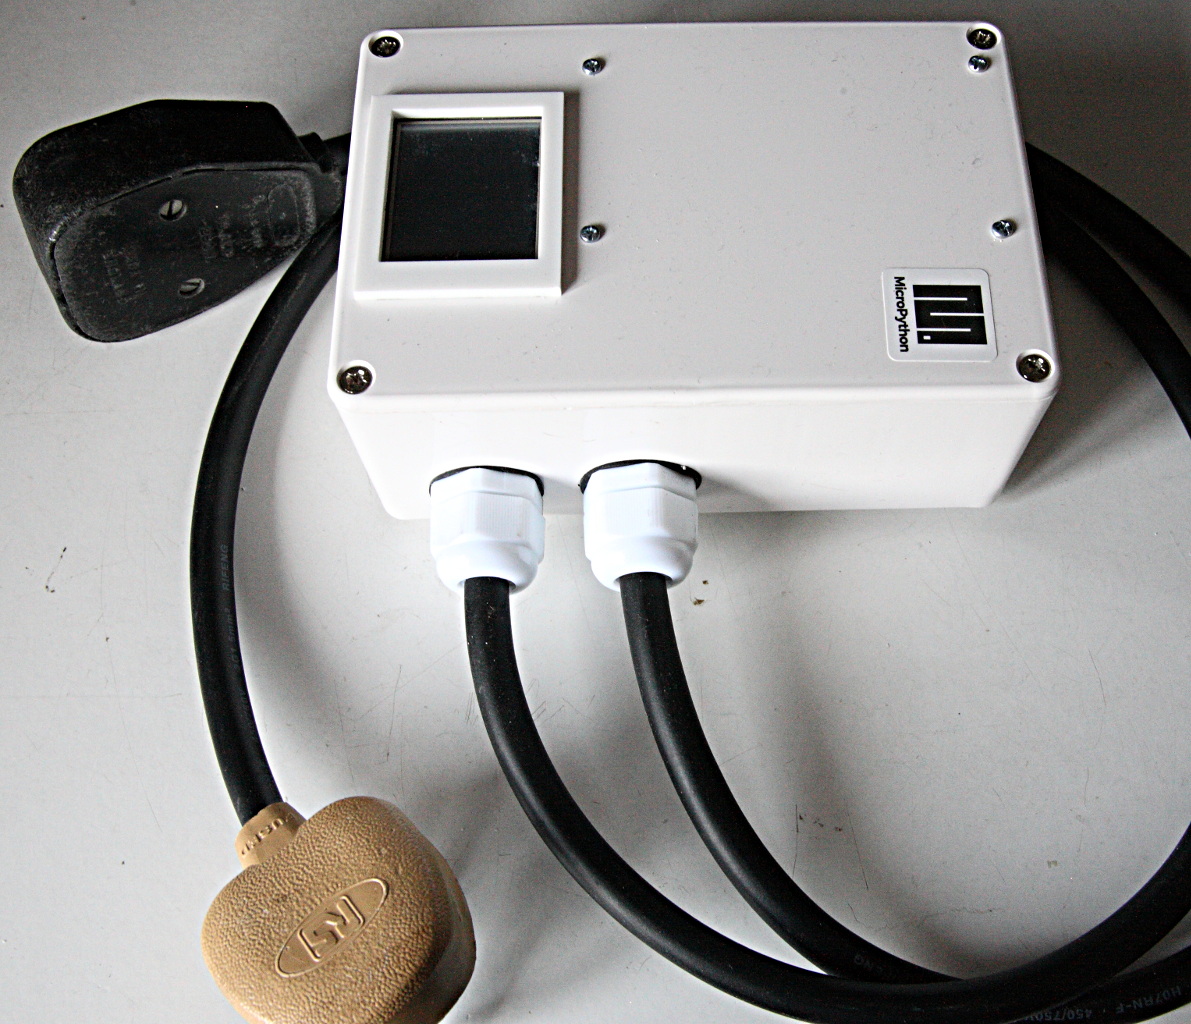
This project is for measuring power consumption of mains operated devices in the range 0-3KW. It performs true vector/phasor measurements and can integrate to determine the mean power consumption of switched devices such as freezers and pumps. It can handle devices with arbitrary power factors including those which both use and generate power. It uses the official lcd160cr display to provide a touch interface with uasyncio.
Here are illustrations of the display. It looks much better in real life than in my photography
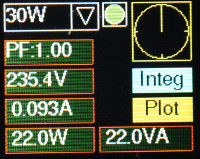
The base screen. Measuring the power of my soldering iron.
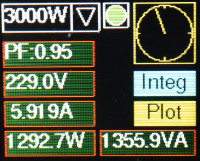
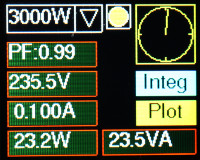
Our microwave oven has a small leading power factor. Note the phasor display; conventionally this should be rotated 90 degrees clockwise. To do.
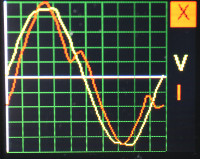
A plot of the current waveform, with the mains voltage as a phase reference.
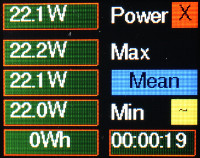
The integration screen. The mean and watt-hour total update continuously for as long as the screen is kept open. The mean display can be toggled by the button on the right to show the maximum power input to the grid (for generating devices).
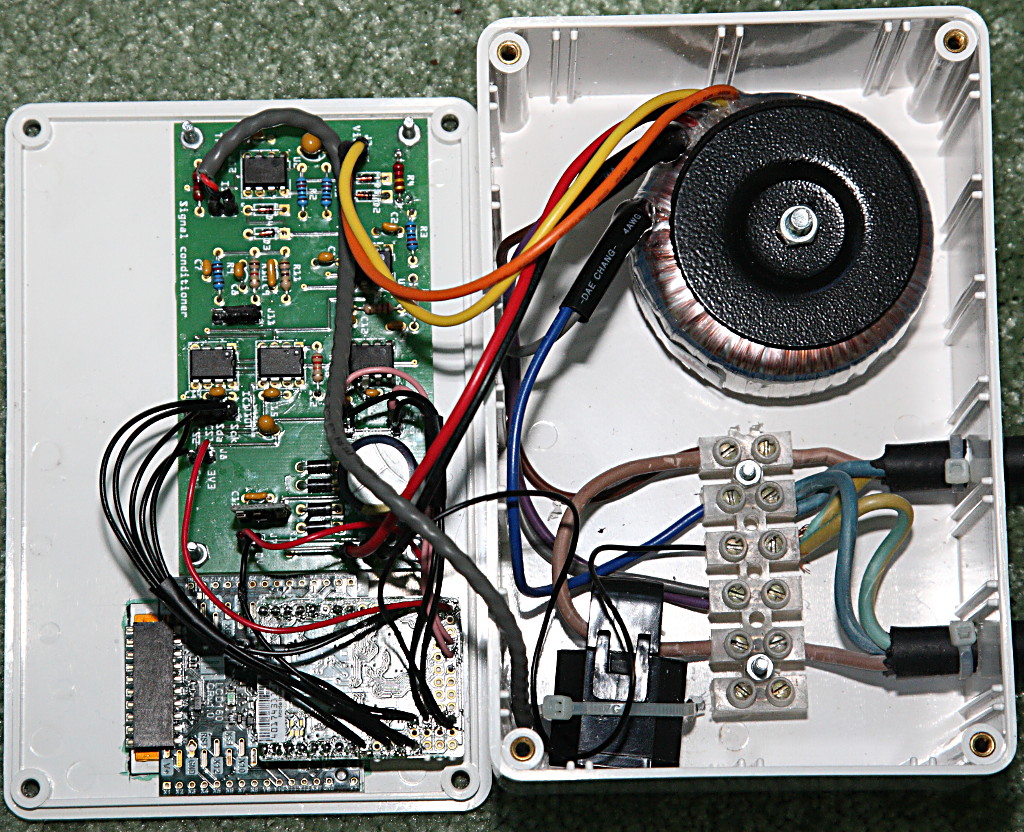
The green PCB houses a transconductance amplifier for the current transformer, matched anti-aliasing filters for voltage and current signals and a programmable gain amplifier to extend the dynamic range of the ADC (for the current measurement only). However the device is remarkably accurate even when measuring my soldering iron on the 3KW range which says something for the Pyboard ADC's. Compare and contrast
Note that the plot screen provides a snapshot of the current sample set: it shows a single shot and is not a continuously updating oscilloscope display. The device takes 400 sample pairs of voltage and current as fast as MicroPython can do it. This is sufficient to capture two full cycles at 50Hz. It then processes and displays the result, before repeating the cycle. The result is an update rate of about 1Hz. The algorithm prioritises accuracy in the presence of noise over performance and I have made no attempt to improve the latter. I doubt that doing so would offer any benefit in terms of its utility as a measuring instrument.
I've now replaced the dodgy tie-wrap strain relief in the pictures above with proper cable glands.
GUI code https://github.com/peterhinch/micropyth ... cr-gui.git.
I haven't posted details of the design as I doubt anyone else would want to build one, but if there's any interest I could do so.
Here are illustrations of the display. It looks much better in real life than in my photography
The base screen. Measuring the power of my soldering iron.
Our microwave oven has a small leading power factor. Note the phasor display; conventionally this should be rotated 90 degrees clockwise. To do.
A plot of the current waveform, with the mains voltage as a phase reference.
The integration screen. The mean and watt-hour total update continuously for as long as the screen is kept open. The mean display can be toggled by the button on the right to show the maximum power input to the grid (for generating devices).
The green PCB houses a transconductance amplifier for the current transformer, matched anti-aliasing filters for voltage and current signals and a programmable gain amplifier to extend the dynamic range of the ADC (for the current measurement only). However the device is remarkably accurate even when measuring my soldering iron on the 3KW range which says something for the Pyboard ADC's. Compare and contrast
Note that the plot screen provides a snapshot of the current sample set: it shows a single shot and is not a continuously updating oscilloscope display. The device takes 400 sample pairs of voltage and current as fast as MicroPython can do it. This is sufficient to capture two full cycles at 50Hz. It then processes and displays the result, before repeating the cycle. The result is an update rate of about 1Hz. The algorithm prioritises accuracy in the presence of noise over performance and I have made no attempt to improve the latter. I doubt that doing so would offer any benefit in terms of its utility as a measuring instrument.
I've now replaced the dodgy tie-wrap strain relief in the pictures above with proper cable glands.
GUI code https://github.com/peterhinch/micropyth ... cr-gui.git.
I haven't posted details of the design as I doubt anyone else would want to build one, but if there's any interest I could do so.