Electrical network analyser/signal generator
Posted: Wed Dec 13, 2017 6:51 pm
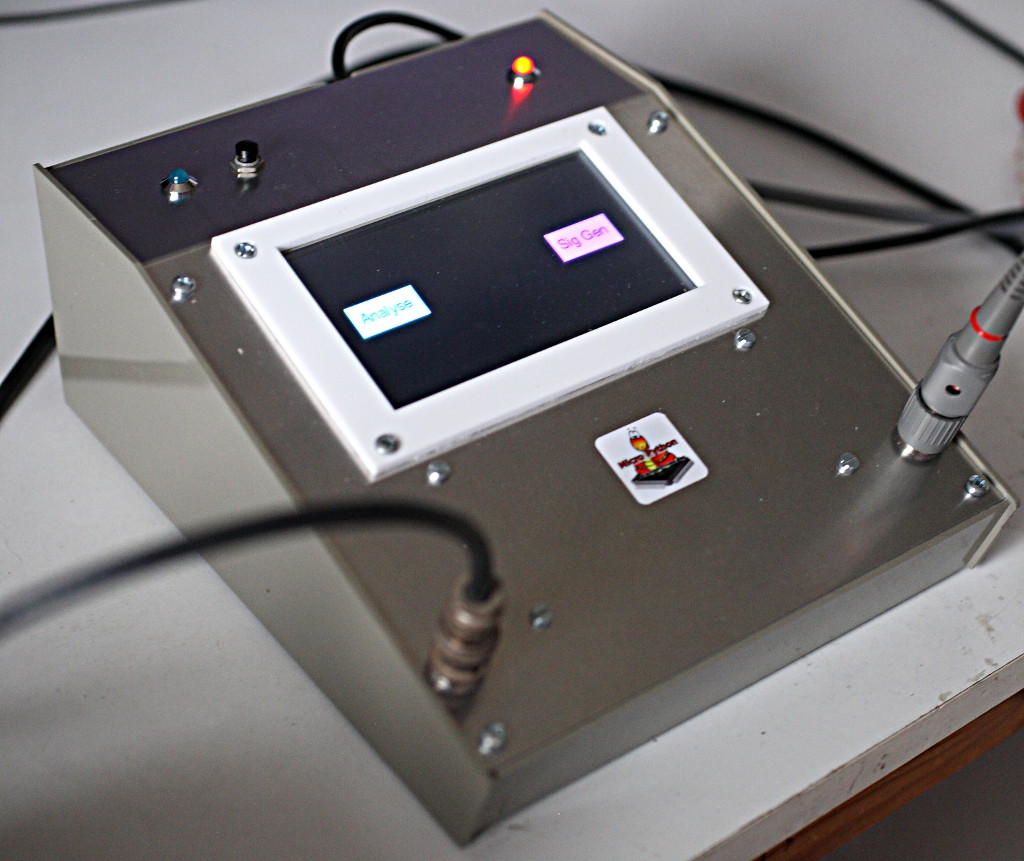
This uses a Pyboard driving a 4.3inch TFT display with touchscreen controller. It currently has two modes, a signal generator capable of producing sine, pulse, sawtooth, triangle and random noise and an electrical network analyser which can produce Bode and Nyquist plots of arbitrary linear networks. It is based on a simple analog PCB which amplifies and level-shifts a Pyboard DAC to produce an output of up to +-3.3V and capable of driving loads as low as 8Ω. The input circuit has a 1MΩ input impedance and level shifts voltages in that range to match the Pyboard ADC. DC coupling is used throughout. It includes a programmable gain amplifier to extend the dynamic range of the Pyboard ADC. The display hardware uses the PCB of @Robert-hh together with his display driver code and my touch GUI interface.
This image shows the starting instrument selection screen.
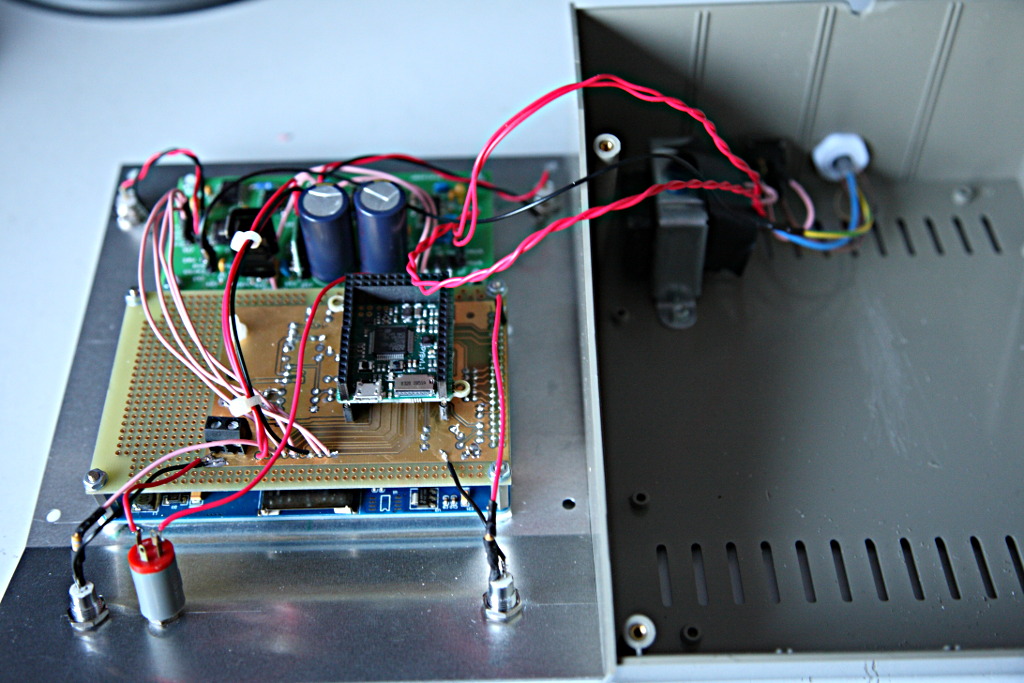
Internal construction:
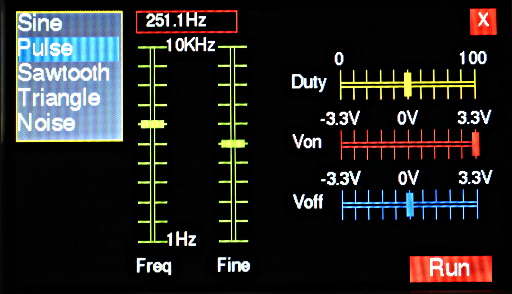
This is the control panel for the signal generator. The coarse and fine frequency controls enable precise frequency selection over a 1Hz-10KHz range.
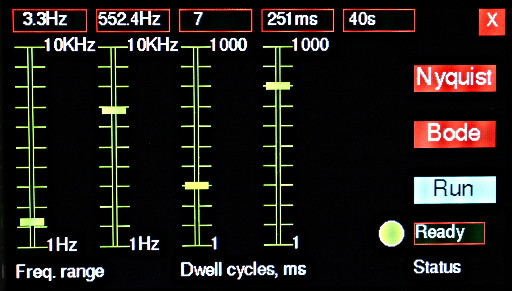
And this for the network analyser. This works using a stepwise-swept sine wave generator. The "dwell" controls determine the duration of running at each frequency point in terms of time and cycles: a delay before reading provides high-Q circuits with time to stabilise.
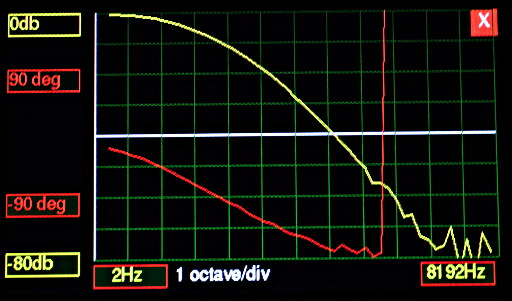
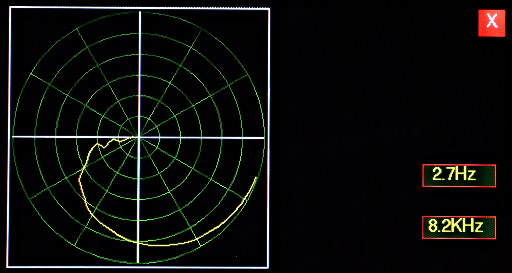
Here are some samples. Firstly a classic second order passive low-pass filter. Bode and Nyquist:
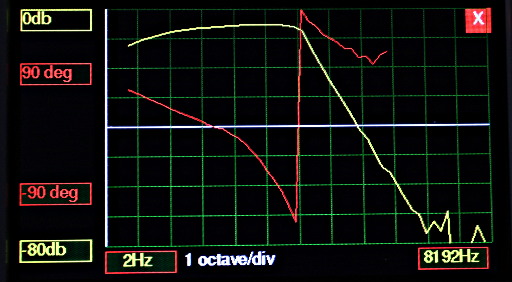
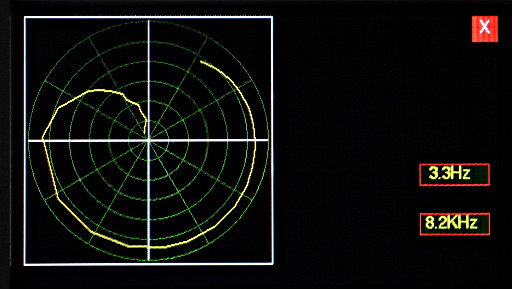
A third-order Sallen-Key low-pass filter with 100Hz cutoff cascaded with a first-order passive high pass filter:
Lastly, for comedy value, I tried an audio test. Bear in mind that the speaker was not a particularly good one, the microphone was an ancient Grundig of unknown quality, the mic preamp was lashed up on a breadboard and the test was done indoors in a small resonant room. Exactly how not to do these things...
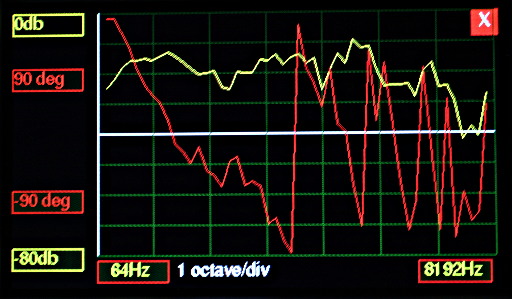
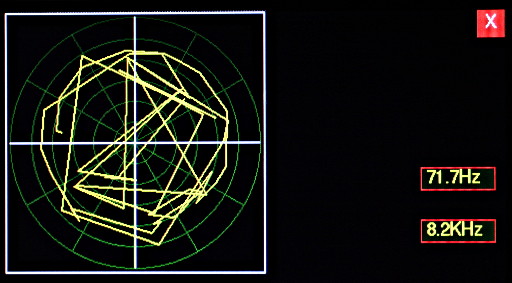
The wild phase changes are of course due to the time delay between the speaker and the mic: what's really needed is a means of displaying the departure from linear phase. For an even greater comedy effect here is the Nyquist plot. This shows the limitation of my instrument in that there are only 50 (logarithmic) frequency steps, so a nice neat spiral it is not!
For anyone still following there were two significant challenges. The first is getting phase measurements from the Pyboard, which does not currently support the more advanced ADC modes of the chip. I use DAC continuous mode to generate the sinewave, feeding it back into an ADC. I then detect a positive going transition and start an ADC timed read of the input signal. Some phase compensation is applied to try to offset errors caused (presumably) by a time delay in initiating the read. Phase is determined by correlating the input sample set with calculated sine and cosine values. In practice phase measurements lose accuracy above about 5KHz and below about -50dB amplitude, and I stop trying to perform the measurement outside certain thresholds of amplitude and frequency. I believe this performance could be improved with better linear circuit design and construction, more noise-immune phase detection algorithms and/or firmware supporting the dual ADC modes.
The second challenge resulted from the design of the display hardware which uses the two Pyboard DAC pins as part of a fast 8-bit digital port. Re-configuring this would affect Robert Hammelrath's driver and would require a new design of PCB. So I dynamically re-configure the pin as an analog output and suspend display operation while the instrument is producing output. This is less disruptive than you might think.
This image shows the starting instrument selection screen.
Internal construction:
This is the control panel for the signal generator. The coarse and fine frequency controls enable precise frequency selection over a 1Hz-10KHz range.
And this for the network analyser. This works using a stepwise-swept sine wave generator. The "dwell" controls determine the duration of running at each frequency point in terms of time and cycles: a delay before reading provides high-Q circuits with time to stabilise.
Here are some samples. Firstly a classic second order passive low-pass filter. Bode and Nyquist:
A third-order Sallen-Key low-pass filter with 100Hz cutoff cascaded with a first-order passive high pass filter:
Lastly, for comedy value, I tried an audio test. Bear in mind that the speaker was not a particularly good one, the microphone was an ancient Grundig of unknown quality, the mic preamp was lashed up on a breadboard and the test was done indoors in a small resonant room. Exactly how not to do these things...
The wild phase changes are of course due to the time delay between the speaker and the mic: what's really needed is a means of displaying the departure from linear phase. For an even greater comedy effect here is the Nyquist plot. This shows the limitation of my instrument in that there are only 50 (logarithmic) frequency steps, so a nice neat spiral it is not!
For anyone still following there were two significant challenges. The first is getting phase measurements from the Pyboard, which does not currently support the more advanced ADC modes of the chip. I use DAC continuous mode to generate the sinewave, feeding it back into an ADC. I then detect a positive going transition and start an ADC timed read of the input signal. Some phase compensation is applied to try to offset errors caused (presumably) by a time delay in initiating the read. Phase is determined by correlating the input sample set with calculated sine and cosine values. In practice phase measurements lose accuracy above about 5KHz and below about -50dB amplitude, and I stop trying to perform the measurement outside certain thresholds of amplitude and frequency. I believe this performance could be improved with better linear circuit design and construction, more noise-immune phase detection algorithms and/or firmware supporting the dual ADC modes.
The second challenge resulted from the design of the display hardware which uses the two Pyboard DAC pins as part of a fast 8-bit digital port. Re-configuring this would affect Robert Hammelrath's driver and would require a new design of PCB. So I dynamically re-configure the pin as an analog output and suspend display operation while the instrument is producing output. This is less disruptive than you might think.