Hi,
I works a lot and developp this code.
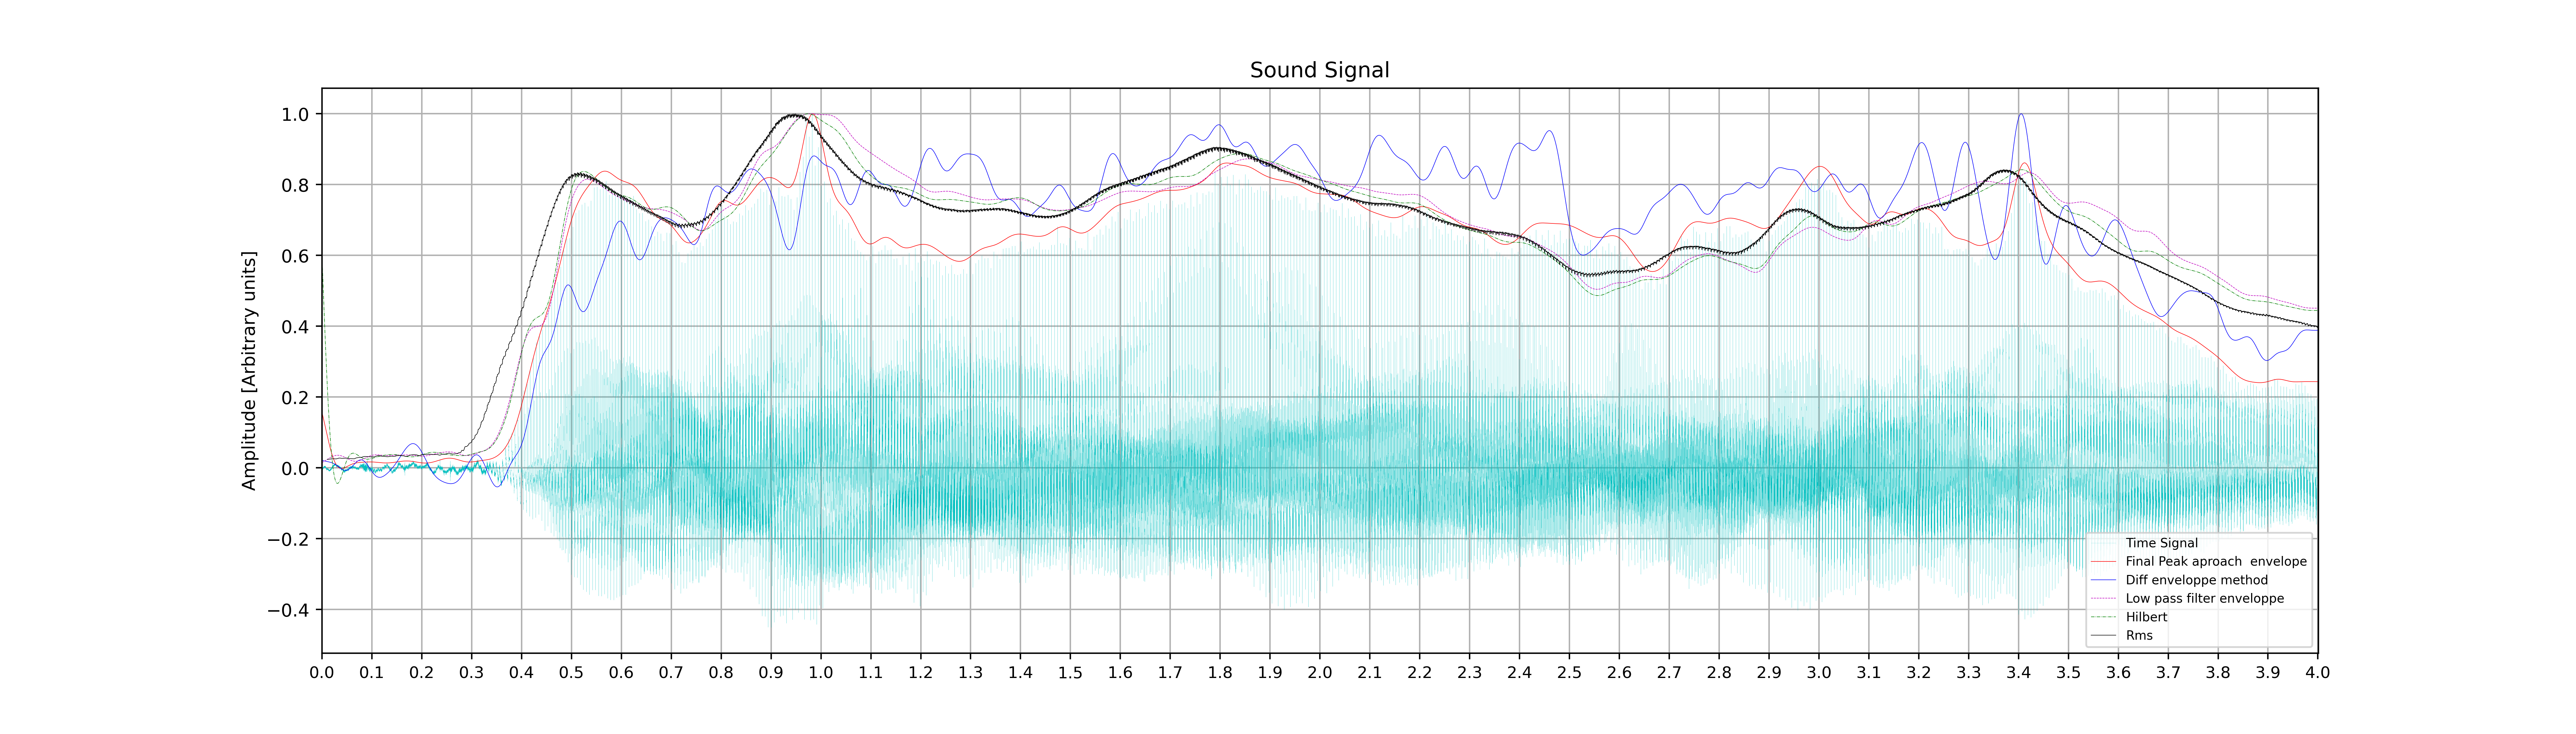
I 've tryied différents methods for finding the enveloppe (peak method, diff method, hilbert and yours)
I have a problem on the diff method that I developped several year ago for my thesis on free reeds acoustics. This was working on matlab but here I get weird result with my python translation.
The matlab code of the diff method (consisting make a differentiate to find peaks and then make a linearization beetwen the maximas) was :
Code: Select all
if (length(x) == length(y) && length(x)>3 && length(find(diff(sign(diff(y)))==-2)) > 3)


if (nargin < 2)||(nargin > 3),
 error('Please see help for INPUT DATA.');
elseif (nargin == 2)
    interpMethod = 'linear';
end

% Find the extreme maxim values
% and the corresponding indexes

extrMaxValue = y(find( diff(sign(diff(y)) )==-2 ) +1);
extrMaxIndex =   find(diff(sign(diff(y)))==-2)+1;

up = extrMaxValue;
up_x = x(extrMaxIndex);

if (length(up_x)>1 && length(x)>1 && length(up)>1 && length(find(diff(up)==0)) < floor(length(up)*0.15) )
yp0 =interp1(up_x,up,x,);
yp=yp0;
And I translate in Python with :
Code: Select all
def getEnvelopeDiff(x ,y):
# Taking the absolute value
	if (x.size == y.size and x.size>3 and np.array(np.where(np.diff(np.sign(np.diff(y)))==-2)).size > 3):
		ind_up,=np.where( np.diff(np.sign(np.diff(y)) )==-2 )
		up = y[ind_up +1 ];
		ind_up_x,=np.where (np.diff(np.sign(np.diff(y)))==-2)
		up_x = x[ind_up_x+1];

		if (up_x.size>1 and x.size>1 and up.size>1 and np.array(np.where(np.diff(up)==0)).size < np.floor(up.size*0.15) ):
			yp0 =np.interp(x,up_x,up);
			yp=yp0;


		return yp
I this my mistake come to translate this matlab code in python :
Code: Select all
extrMaxValue = y(find( diff(sign(diff(y)) )==-2 ) [b]+1[/b]);
This +1, I am not shure I implemented this well in my python code :
Code: Select all
 ind_up,=np.where( np.diff(np.sign(np.diff(y)) )==-2 )
		up = y[ind_up +1 ];
This code was really precize but not here

The full code is here :
Code: Select all
# libraries
import numpy as np
import scipy
import os
import scipy.stats as stats

from scipy.io import wavfile
import wave, struct
import matplotlib.pyplot as pp

from pylab import *
import scipy.signal.signaltools as sigtool
import scipy.signal as signal
from scipy.fftpack import fft

# Here directory (put the name and path). Directory only with .wav files

r_dir ="D:/GoogleDrive/python/test demodulation/"

# Parameters

Fmax         = 10000 #maximum frequency for the sonogram [Hz]
step_time    = 4   #len for the time serie segment  [Seconds]->>>>>>>>> Change it to zoom in the signal time!!
w_cut        = 32   #Frequency cut for our envelope implementation [Hz]
w_cut_simple = 150   #Frecuency cut for the low-pass envelope [Hz]


###################################
#1) Function envelope with rms slide window (for the RMS-envelope implementation)

def window_rms(inputSignal, window_size):
    a2 = np.power(inputSignal,2)
    window = np.ones(window_size)/float(window_size)
    return np.sqrt(np.convolve(a2, window, 'valid'))

##################################

#2) Filter is directly implemented in Abs(signal)

##################################
#3) our implementation !

def getEnvelope(inputSignal):
# Taking the absolute value

    absoluteSignal = []
    for sample in inputSignal:
        absoluteSignal.append (abs (sample))

    # Peak detection

    intervalLength = 400 # change this number depending on your Signal frequency content and time scale
    outputSignal = []

    for baseIndex in range (0, len (absoluteSignal)):
        maximum = 0
        for lookbackIndex in range (intervalLength):
            maximum = max (absoluteSignal [baseIndex - lookbackIndex], maximum)
        outputSignal.append (maximum)

    return outputSignal


def getEnvelopeDiff(x ,y):
# Taking the absolute value
	if (x.size == y.size and x.size>3 and np.array(np.where(np.diff(np.sign(np.diff(y)))==-2)).size > 3):
		ind_up,=np.where( np.diff(np.sign(np.diff(y)) )==-2 )
		up = y[ind_up +1 ];
		ind_up_x,=np.where (np.diff(np.sign(np.diff(y)))==-2)
		up_x = x[ind_up_x+1];

		if (up_x.size>1 and x.size>1 and up.size>1 and np.array(np.where(np.diff(up)==0)).size < np.floor(up.size*0.15) ):
			yp0 =np.interp(x,up_x,up);
			yp=yp0;


		return yp


##################################
#Loop over sound files in directory

for root, sub, files in os.walk(r_dir):
    files = sorted(files)
    for f in files:
        if f.endswith(".wav"):
            w= scipy.io.wavfile.read(os.path.join(root, f))
            base=os.path.basename(f.replace(".wav",""))
            dir = os.path.dirname(base)
            print(os.path.isdir(base))
            if not os.path.isdir(base):
                os.mkdir(base)


            x     = w[1]
            x_size= x.size
            tt    = w[1]


            v1    = np.arange(float (x_size))# not stereo

            c     = np.c_[v1,x]


            cc=c.T #transpose

            x = cc[0]
            x1= cc[1]
            x2= cc[1]#2


        #Low Pass Frequency for Filter definition (envelope case 2)

            W2       = float(w_cut_simple)/w[0] #filter parameter Cut frequency over the sample frequency
            (b2, a2) = signal.butter(1, W2, btype='lowpass')

            #Filter definition for our envelope (3) implementation

            W1       = float(w_cut)/w[0] #filter parameter Cut frequency over the sample frequency
            (b, a)   = signal.butter(4, W1, btype='lowpass')


            p        = np.arange(x_size)*float(1)/w[0]


            stop      = x_size
            step      = int(step_time*w[0]) # Time interval * sample rate
            interval= np.arange(0, x_size,step)


            time1=x*float(1)/w[0]

            ##chop time serie##
            for delta_t in interval:

                x2_part                   = x2[delta_t:delta_t+step]
                time_part                 = time1[delta_t:delta_t+step]
                analytic_signal = signal.hilbert(x2_part)
                hilbert_env = signal.filtfilt(b, a, np.abs(analytic_signal))
                aver_vs                   = getEnvelope(x2_part)
                aver_vs2                   = getEnvelopeDiff(time_part,x2_part)
                filtered_aver_vs          = signal.filtfilt(b, a, aver_vs)
                filtered_aver_vs2          = signal.filtfilt(b, a, aver_vs2)
                #envelope low pass
                filtered_aver_simple      = signal.filtfilt(b, a, np.abs(x2_part))
                filtered_aver_vs_ped_simp = filtered_aver_simple

                x1_part_rms               = window_rms(x2,4048)##envolvente Rms (second parameter is windows size)
                time_rms                  = np.arange(len(x1_part_rms))*float(1)/w[0]
                #Figure definition
                pp.figure(figsize=(20,9.5*0.6))
                pp.title('Sound Signal')

                #Uncoment what envelope you whant to plot

                grid(True)

                #Signal
                label_S,= pp.plot(x*float(1)/w[0],x1/max(x1), color='c',label='Time Signal',linewidth=0.05)


                # peak envelope #
                envelope_1,= pp.plot(time_part,filtered_aver_vs/max(filtered_aver_vs), color='r',label='Final Peak aproach  envelope',linewidth=0.3)
                # diff envelope #
                envelope_2,= pp.plot(time_part,filtered_aver_vs2/max(filtered_aver_vs2), color='b',label='Diff enveloppe method',linewidth=0.3)
                # Low pass filter envelope #
                envelope_3,= pp.plot(time_part,filtered_aver_vs_ped_simp/max(filtered_aver_vs_ped_simp), linestyle='--',color='m',label='Low-pass Filter envelope',linewidth=0.3)
                # Hilbert enveloppe #

                envelope_4,= pp.plot(time_part,hilbert_env/max(hilbert_env), linestyle='-.',color='g',label='Hilbert Enveloppe',linewidth=0.3)

                # Rms envelope #
                envelope_5,= pp.plot(time_rms+500/w[0],x1_part_rms/max(x1_part_rms), linestyle='-',color='k',label='RMS aproach envelope',linewidth=0.3)

                pp.ylabel('Amplitude [Arbitrary units]')
                pp.xlim([delta_t*float(1)/w[0],(delta_t+step)*float(1)/w[0]+0.001])
                pp.xticks(np.arange(delta_t*float(1)/w[0],(delta_t+step)*float(1)/w[0]+0.001,0.1),fontsize = 9)
                #pp.yticks(np.arange(-15000,15000+5000,5000),fontsize = 12)
                pp.tick_params( axis='x', labelbottom='off')
                pp.tick_params( axis='y', labelleft='off')

                pp.legend([label_S,envelope_1,envelope_2,envelope_3,envelope_4,envelope_5],['Time Signal','Final Peak aproach  envelope','Diff enveloppe method','Low pass filter enveloppe','Hilbert','Rms'],fontsize= 'x-small',loc=4)
                #pp.legend([label_S,envelope_1],['Time Signal','Final Peak aproach  envelope'],fontsize= 'x-small',loc=4)


                figname = "%s.png" %(str(base)+'_signal_zoom_'+str(delta_t*float(1)/w[0]))
                pp.savefig(os.path.join(base,figname),dpi=400)
                pp.close('all')

            ###############################################################
            #save in plot file txt with data if necesary

            #f_out     = open('plots/%s.txt' %(str(base)+'_'+str(delta_t*float(1)/float(w[0]))), 'w')
            #xxx       = np.c_[time_part,x2_part,filtered_aver,filtered_aver_vs]
            #np.savetxt(f_out,xxx,fmt='%f %f %f %f',delimiter='\t',header="time   #sound   #sound-evelope   #vS-envelope")

            print ('.---All rigth!!!----.')
I don't know which code is easyly implemented on micropython for realtime apllication (I can use a powerfull Stm32H7)
and all the plots, sounds and numpy arrays (.txt) are in this folder :
https://labodezao.fr/old/share/beat_files.zip